The objective of this project was to develop an elevation/bathymetry grid for the Raritan River Basin as a precursor for a hydrodynamic model. In addition, by identifying data gaps the project provides guidance on future side-scan sonar surveys of the river. Finally, the project assessed options for processing of side-scan sonar data and makes recommendations on data processing options for the new side scan sonar that was recently purchased by the Department of Marine and Coastal Science (DMCS). Research and data development was conducted by the team of Robert Chant, Nick Beaird, and Travis Miles( all from DMCS at the School of Environmental & Biological Sciences), and Roger (Ruo-Quin) Wang (Civil and Environmental Engineering Department at the School of Engineering). Elias Hunter (DMCS) facilitated the availability of the bathymetric dataset through the ERRDAP server.
Background
Hydrodynamic and storm surge models are essential tools to investigate and understand the circulation, vulnerability to extreme precipitation and surge events, fate of pollutants, and overall water quality in the Raritan River and Bay. To develop these models requires an accurate discretization of both the bathymetry of the river and the topography of the surrounding land. While several data sets exist, such as FEMA charts, NOAA soundings, USGS topographic maps and LIDAR data of the shoreline — significant work is required to fuse these data into a single topographic data set suitable for incorporation into a hydrodynamic/storm surge model of the region. Moreover, examination of NOAA’s 30m resolution of the River’s bathymetry reveals a poor representation of the main stem of the tidal river and does not extend to the Head of Tide.
The goal of this effort was to: (1) synthesize existing bathymetric and topographic data to produce a single gridded data set of the Raritan that can be used for future model development; (2) identify data gaps to be filled with targeted side-scan sonar surveys of the river; and (3) develop software to process side-scan data to be disseminated to educational efforts. We anticipate that side-scan surveys will be conducted as part of field components of the Ocean Modeling and Data Analysis class, the newly developed Masters in Integrated Ocean Observing, and incorporated into other educational units across the university. The students in these courses will directly benefit from the processing software developed in topic 3.
Data Sets
Land – A grid was defined with 10m resolution that encompassed the domain between Longitude 74.56 W 74.2701W and Latitude 40.4N and 40.6N. Within this domain we defined a land-sea mask for the grid based on shoreline data from the NOAA Continually Updated Shoreline Product (CUSP) (https://shoreline.noaa.gov/data/datasheets/cusp.html). For regions above sea-level elevation data from the USGS National Elevation Data Set was interpolated to our grid. This data set has resolution of 1/3 of an arc-second which roughly corresponds to 10m resolution.
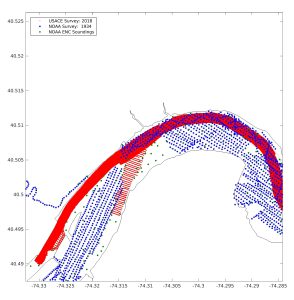
Figure 3. Zoom in of lower Raritan showing locations of soundings used for river’s bathymetry that included the 2018 USACE survey (red), the 1934 NOAA survey (blue) and soundings from the NOAA ENC of the region (Green).
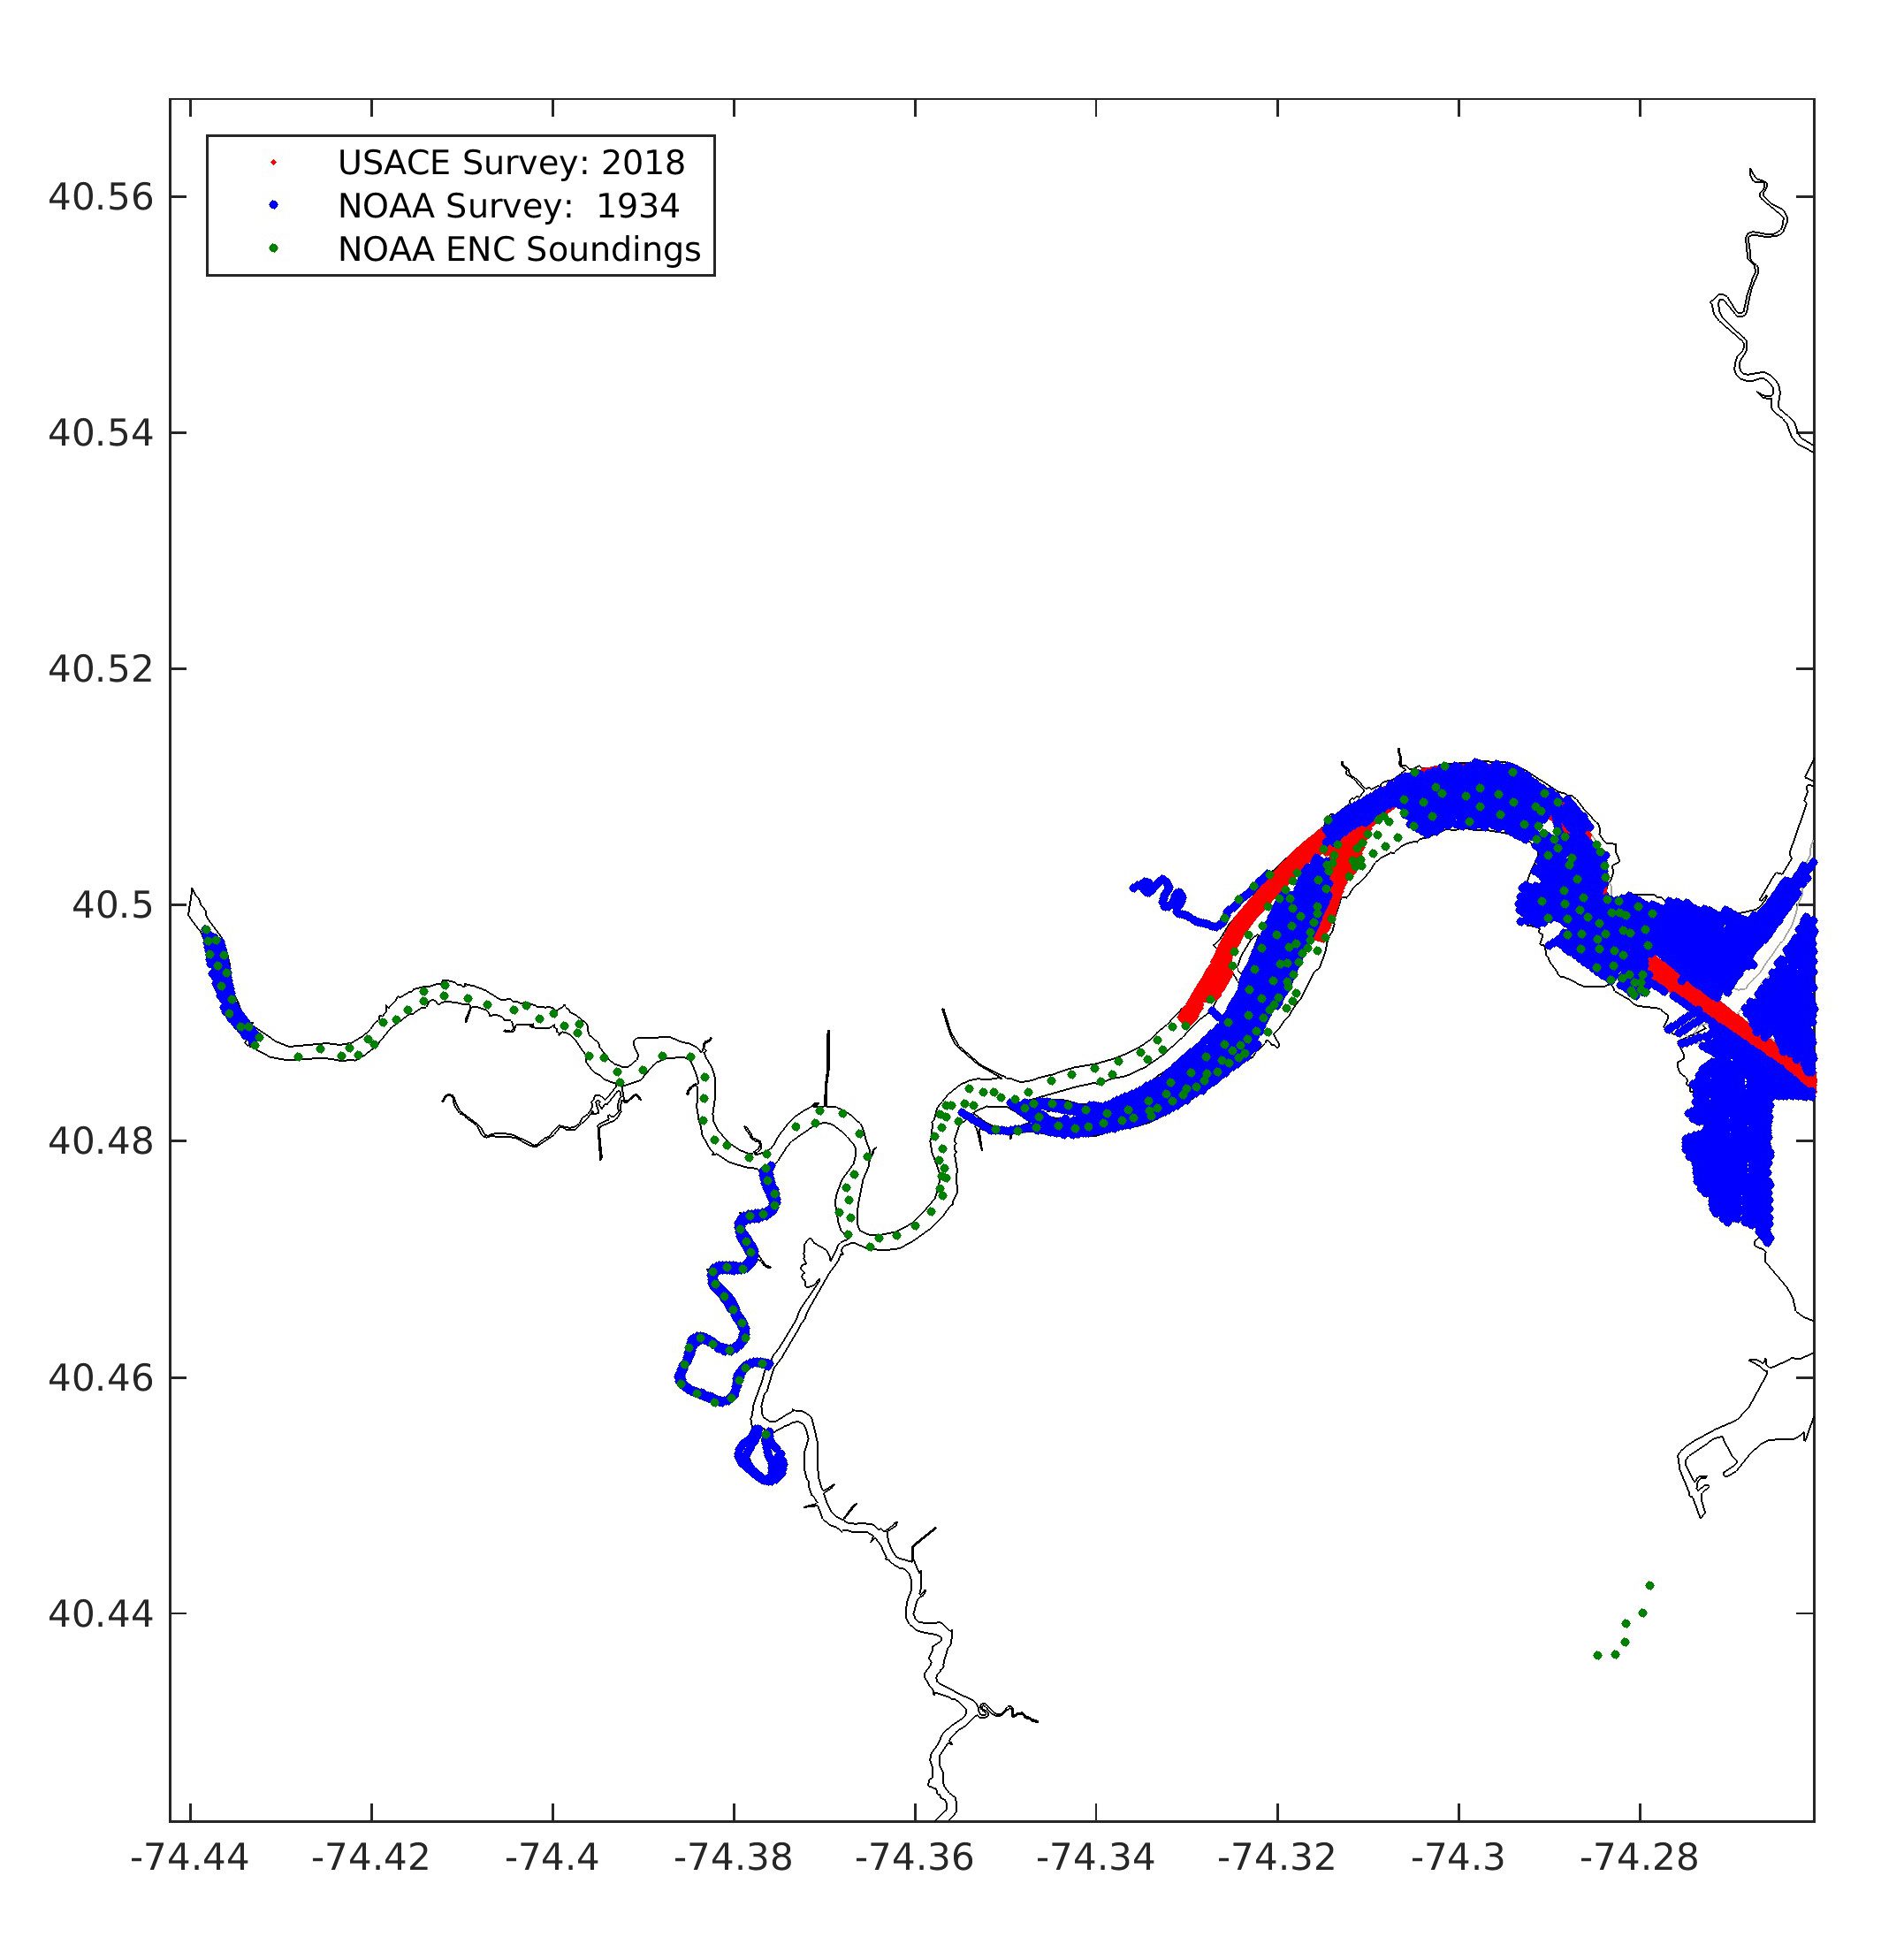
Figure 2. Locations of soundings used for river’s bathymetry that included the 2018 USACE survey (red), the 1934 NOAA survey (blue) and soundings from the NOAA ENC of the region (Green).
Sea – We used 3 data sets to define the bathymetry of the river. The data set with the best resolution was from a US Army Corp of Engineers survey that extended from the mouth of Perth Amboy through Red Root Reach (Figures 2 and 3) (https://catalog.data.gov/dataset/usgs-ned-1-3-arc-second- n41w075-1-x-1-degree-gridfloat-2017) and included a portion of Titanium Reach (Figure 3). This data set had resolution of approximately 1m and thus the data was spatially filtered to match the 10m resolution set in the domain.
The two remaining data sets were of low resolution and unfortunately from outdated NOAA surveys. The first is from National Ocean Service survey (H05647) that occurred 1934 We interpolated this data to the 10m grid (Figure 2). The final data set was soundings we took off the NOAA Electronic Navigational Chart (US5NJ12M) of the river. This chart is based on a compilation of surveys that occurred between 1900-1939. This data set was also interpolated to the 10m Raritan River grid. Finally, underwater grid-points where there were no good sounding data were set to a depth of 1m. Most of these points are upstream of New Brunswick.
The final product can be down loaded online at http://tds.marine.rutgers.edu/erddap/griddap/RARITAN_ELEVATION.graph and available in a number of formats including ASCII, MATLAB and NetCDF. The datum is set to Mean Low Water. A map showing the final product is shown in Figure 1 across the entire domain. Figures 4, 5 and 6 show the elevation and bathymetry in the vicinity of New Brunswick, Sayerville and Perth Amboy.
Data Gaps
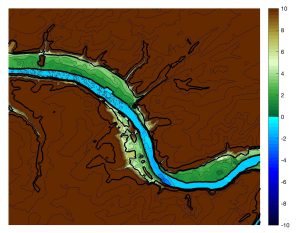
Figure 4. Elevation/bathymetry in vicinity of New Brunswick. Underwater bathymetric contours are at 1m intervals. Thick lines on land show 0,5 and 15 m isobath. Contour interval is 1m below 5m isobath. Contour interval is 5m above the 4m isobath.
Aside from the points where no sounding data existed, the data upstream of Red Root Reach is generally of low resolution and does not resolve the channel at all. This is apparent in Figure 5 that do not resolve the known lateral variability in channel bathymetry. This suggests that much of the river upstream of Red Root Reach needs to be surveyed to accurately resolve the bathymetry. Nevertheless, the elevation maps nicely show the flood plains, which appear mostly as green in Figures 1, 4, 5 and 6 (see below). Nevertheless, this grid is probably sufficient to produce a decent barotropic tidal model of the river and a flood prediction model of the region. However, we would be recommend using this bathymetry to model salinity or sediment transport because processes controlling their transport are known to be strongly influenced by shoal/channel bathymetry.
Side Scan Data Analysis
The final objective of this grant was to develop software tools that would be usable by students to process and visualize side-scan sonar data. Through a combination of open-source software (mbsystem) and tools developed in-house, we were able to process and visualize sample side scan data. Given time constraints, however, the resulting product was cumbersome to use. With more time and resources, we could develop the product further. However, given the availability of commercial software (Chesapeake Technologies SonarWIZ, HYPACK), the cost of such development would probably far exceed the cost of a software license. Therefore, we suggest investing in a commercial product (~$5000) as the most cost-efficient strategy going forward.
For more information about this work, contact Dr. Robert Chant, Professor, SEBS, DMCS at chant@marine.rutgers.edu. This work was performed with the support of a 2019 Rutgers Raritan River mini-grant.
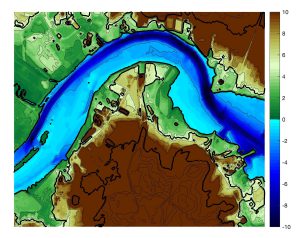
Figure 6. Elevation/bathymetry in vicinity of Perth Amboy. Underwater bathymetric contours are at 2m intervals. Thick lines on land show 0,5 and 15 m isobath. Contour interval is 1m below 5m isobath. Contour interval is 5m above the 4m isobath.
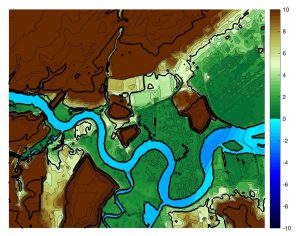
Figure 5. Elevation/bathymetry in vicinity of Sayerville. Underwater bathymetric contours are at 1m intervals. Thick lines on land show 0,5 and 15 m isobath. Contour interval is 1m below 5m isobath. Contour interval is 5m above the 4m isobath.